Monitoring Linux hosts using Grafana Cloud, Prometheus and Node Exporter
Introduction
I’ve recently started using the setup below to scrape metrics from my Raspberry Pi:
- 🔢 Node exporter exports metrics of the Linux host
- 🗄️ Prometheus stores all metrics and pushes them to Grafana
- 📈 Grafana visualizes all metrics via a centralized dashboard
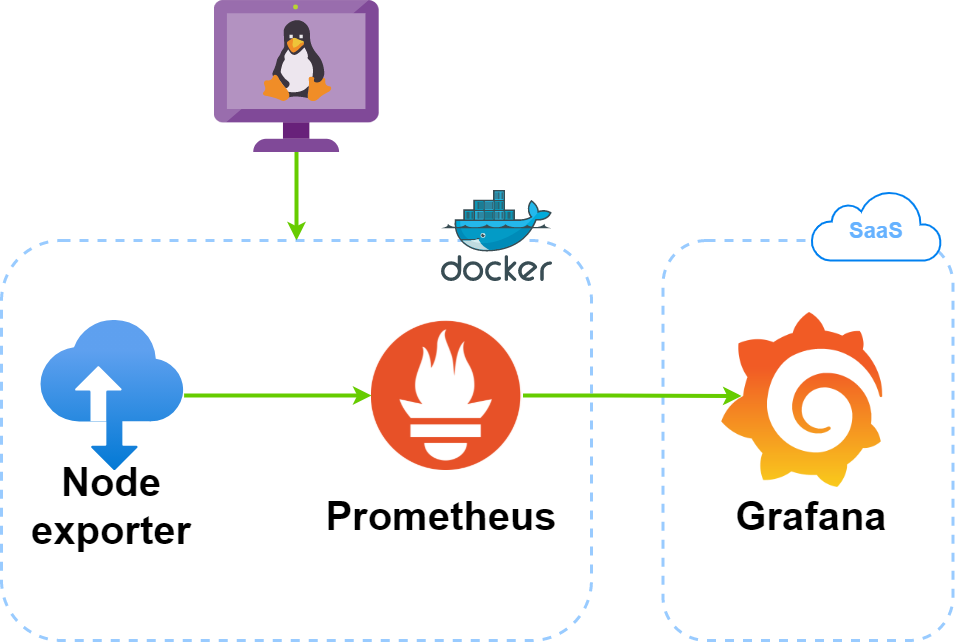
I’m making use of Grafana Cloud (SaaS), but you might just as well run Grafana in a separate docker container, or add it to Docker Compose.
Grafana Cloud
Start by signing up for Grafana Cloud. I’ve used their free tier, which actually is a pretty good offering:
Free forever access:
- 10,000 series for Prometheus or Graphite metrics
- 50 GB of logs
- 50 GB of traces
- 14-day retention for metrics and logs
- Access for up to 3 team members
Once you’ve successfully signed up, log in to the Grafana Cloud Portal and click the Details button on the Prometheus card. This will show you the details for your Prometheus instance:
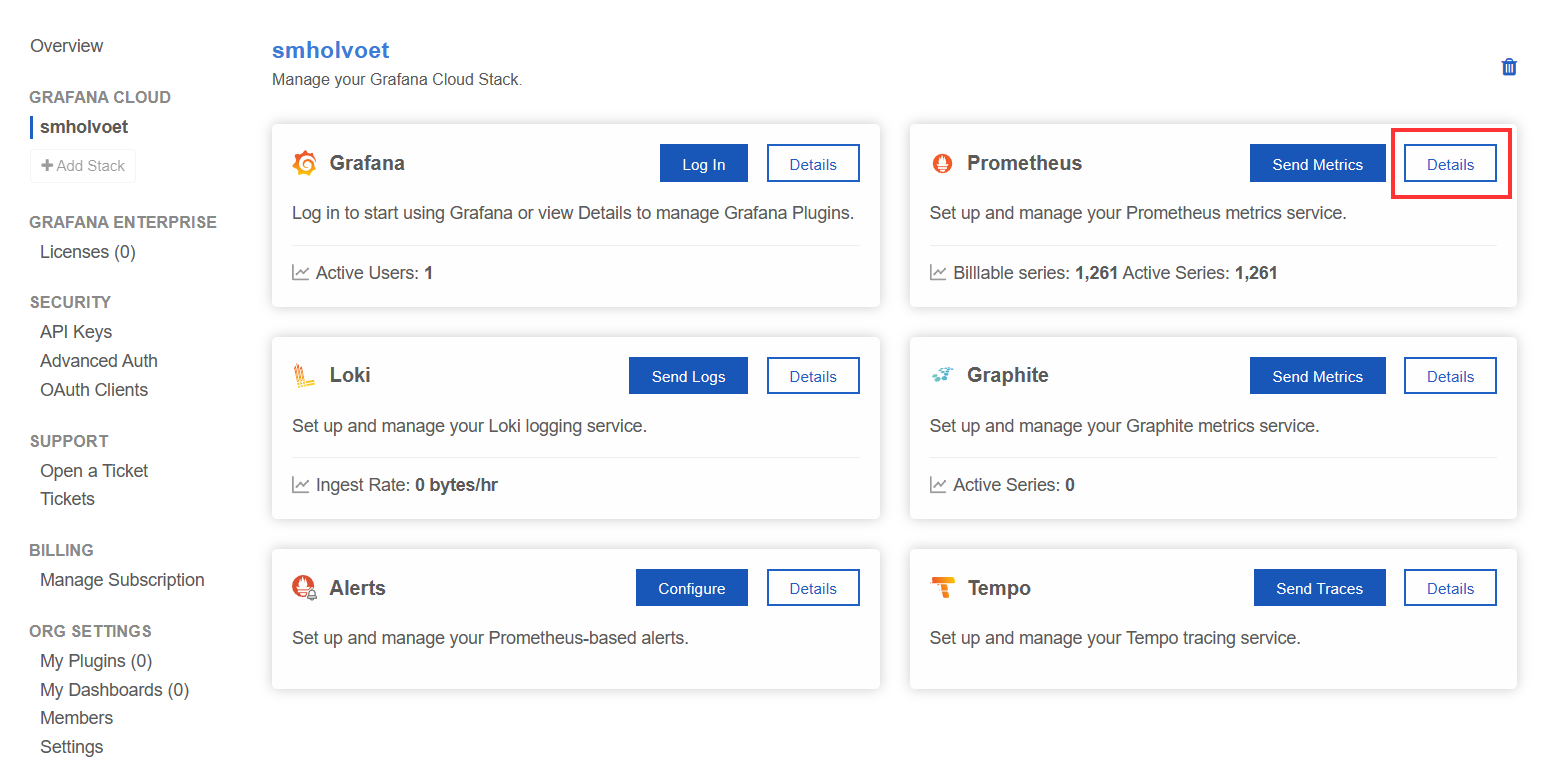
Scroll down to the Password / API Key section to generate your API key.
Give your API key a meaningful name and make sure to assign the MetricsPublisher role:
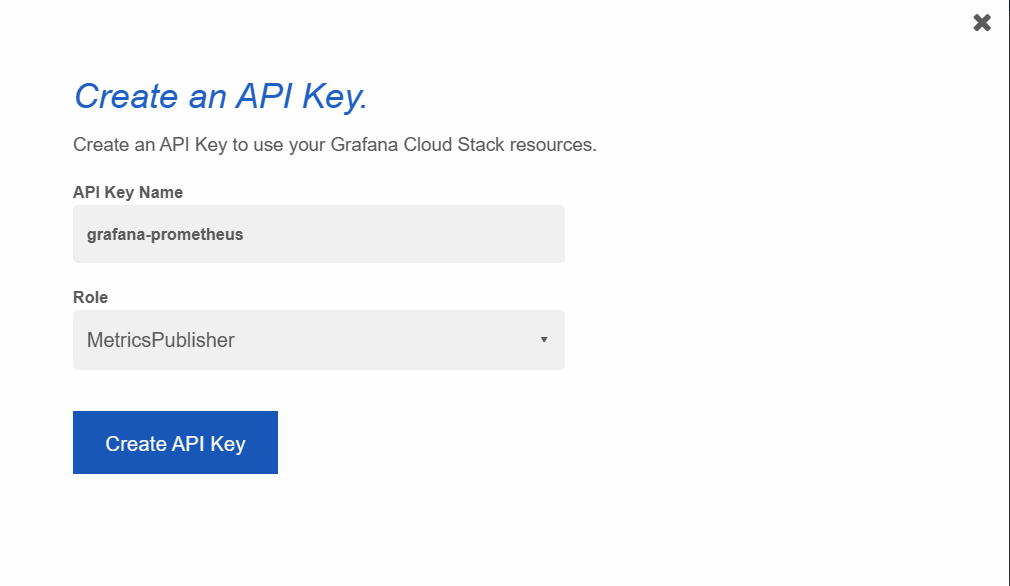
Now copy the snippet and the bottom, replacing your API key in the process:
remote_write:
- url: https://prometheus-prod-01-eu-west-0.grafana.net/api/prom/push
  basic_auth:
    username: 123456
    password: < 🔑 API Key goes here >
We’ll use these details to configure Prometheus later on in this post.
Docker Compose
Create a docker-compose.yml file containing the code below:
version: "3.8"

services:
  node-exporter:
    image: prom/node-exporter:latest
    container_name: node-exporter
    restart: unless-stopped
    volumes:
      - /proc:/host/proc:ro
      - /sys:/host/sys:ro
      - /:/rootfs:ro
    command:
      - '--path.procfs=/host/proc'
      - '--path.rootfs=/rootfs'
      - '--path.sysfs=/host/sys'
      - '--collector.filesystem.mount-points-exclude=^/(sys|proc|dev|host|etc)($$|/)'
    expose:
      - 9100
    networks:
      - monitoring

  prometheus:
    image: prom/prometheus:latest
    user: root
    container_name: prometheus
    restart: unless-stopped
    volumes:
      - ./prometheus/prometheus.yml:/etc/prometheus/prometheus.yml
      - ./prometheus/data:/prometheus
    command:
      - '--config.file=/etc/prometheus/prometheus.yml'
      - '--storage.tsdb.path=/prometheus'
      - '--web.console.libraries=/etc/prometheus/console_libraries'
      - '--web.console.templates=/etc/prometheus/consoles'
      - '--web.enable-lifecycle'
    expose:
      - 9090
    networks:
      - monitoring

networks:
  monitoring:
    driver: bridge
The above Docker Compose contains just 2 containers:
- Node exporter, which as the name suggests will be responsible for exporting hardware and OS metrics exposed by our Linux host.
- Prometheus is a time-series database similar to InfluxDB. It will retrieve the data from Node exporter, store it and pass it onto our Grafana Cloud instance. This is done using the remote-write feature of Grafana.
Prometheus configuration
Create a prometheus folder with the following contents:
data: this subfolder will hold the prometheus dataprometheus.yml: our Prometheus configuration file
Copy the contents below to your prometheus.yml file. Make sure to replace the remote_write section with the one you copied earlier. Feel free to change the scrape_interval to something more suitable (e.g. 120s)
global:
  scrape_interval: 5s

scrape_configs:
  - job_name: "prometheus"
    scrape_interval: 5s
    static_configs:
    - targets: ["localhost:9090"]

  - job_name: "node"
    static_configs:
    - targets: ["node-exporter:9100"]

remote_write:
  - url: "https://prometheus-prod-01-eu-west-0.grafana.net/api/prom/push"
    basic_auth:
      username: "123456"
      password: "..."
Your directory structure should now look like this:
.
├── 🐳 docker-compose.yml
├── 📂 prometheus
│   ├── 📂 data
│   └── ⚙ prometheus.yml
└── ...
Run it
Go ahead and 🚀 fire everything up using docker-compose up -d.
Wait for docker-compose to pull the images and start up both containers. Verify both containers are running:
docker ps
CONTAINER ID   IMAGE                                COMMAND                  CREATED         STATUS                 PORTS          NAMES
7991b4562a3d   prom/prometheus:latest               "/bin/prometheus --c…"   4 hours ago     Up 4 hours             9090/tcp       prometheus
b7a10b1640fa   prom/node-exporter:latest            "/bin/node_exporter …"   4 hours ago     Up 4 hours             9100/tcp       node-exporter
Verify node-exporter is working OK by taking a peek at the logs:
docker-compose logs -f node-exporter
node-exporter       | level=info ts=2021-11-08T16:05:38.196Z caller=node_exporter.go:115 collector=thermal_zone
node-exporter       | level=info ts=2021-11-08T16:05:38.196Z caller=node_exporter.go:115 collector=time
node-exporter       | level=info ts=2021-11-08T16:05:38.196Z caller=node_exporter.go:115 collector=timex
node-exporter       | level=info ts=2021-11-08T16:05:38.196Z caller=node_exporter.go:115 collector=udp_queues
node-exporter       | level=info ts=2021-11-08T16:05:38.196Z caller=node_exporter.go:115 collector=uname
node-exporter       | level=info ts=2021-11-08T16:05:38.196Z caller=node_exporter.go:115 collector=vmstat
node-exporter       | level=info ts=2021-11-08T16:05:38.196Z caller=node_exporter.go:115 collector=xfs
node-exporter       | level=info ts=2021-11-08T16:05:38.196Z caller=node_exporter.go:115 collector=zfs
node-exporter       | level=info ts=2021-11-08T16:05:38.197Z caller=node_exporter.go:199 msg="Listening on" address=:9100
node-exporter       | level=info ts=2021-11-08T16:05:38.199Z caller=tls_config.go:191 msg="TLS is disabled." http2=false
Do the same for prometheus, scan for any error messages 👀:
docker-compose logs -f prometheus
prometheus          | ts=2021-11-08T16:05:38.522Z caller=main.go:1033 level=info msg="Completed loading of configuration file" filename=/etc/prometheus/prometheus.yml totalDuration=6.67869ms db_storage=5.333µs remote_storage=3.834277ms web_handler=4.185µs query_engine=7.111µs scrape=1.3618ms scrape_sd=323.381µs notify=4.852µs notify_sd=13.352µs rules=32.074µs
prometheus          | ts=2021-11-08T16:05:38.522Z caller=main.go:811 level=info msg="Server is ready to receive web requests."
prometheus          | ts=2021-11-08T16:06:04.287Z caller=dedupe.go:112 component=remote level=info remote_name=9f2ccd url=https://prometheus-prod-01-eu-west-0.grafana.net/api/prom/push msg="Done replaying WAL" duration=25.76761713s
Grafana dashboard setup
Let’s first verify whether Grafana is actually receiving metrics from Prometheus. Click the Explore tab at the left, select your Prometheus instance at the top left and open the Metrics browser. This dropdown listshould contain a list of all the metrics which node exporter was able to scrape from your host system:
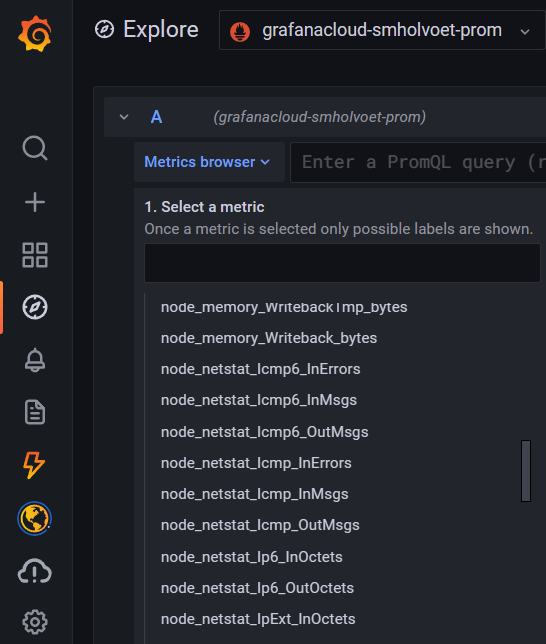
If you can’t see any metrics here, have a look at the logs of your Prometheus container and scan for any error messages. There could be an issue with the API key or your Prometheus config file for example.
We’ll now import the Node Exporter Full dashboard. If you’re interested, you can have a look at the code behind this, over at rfrail3/grafana-dashboards.
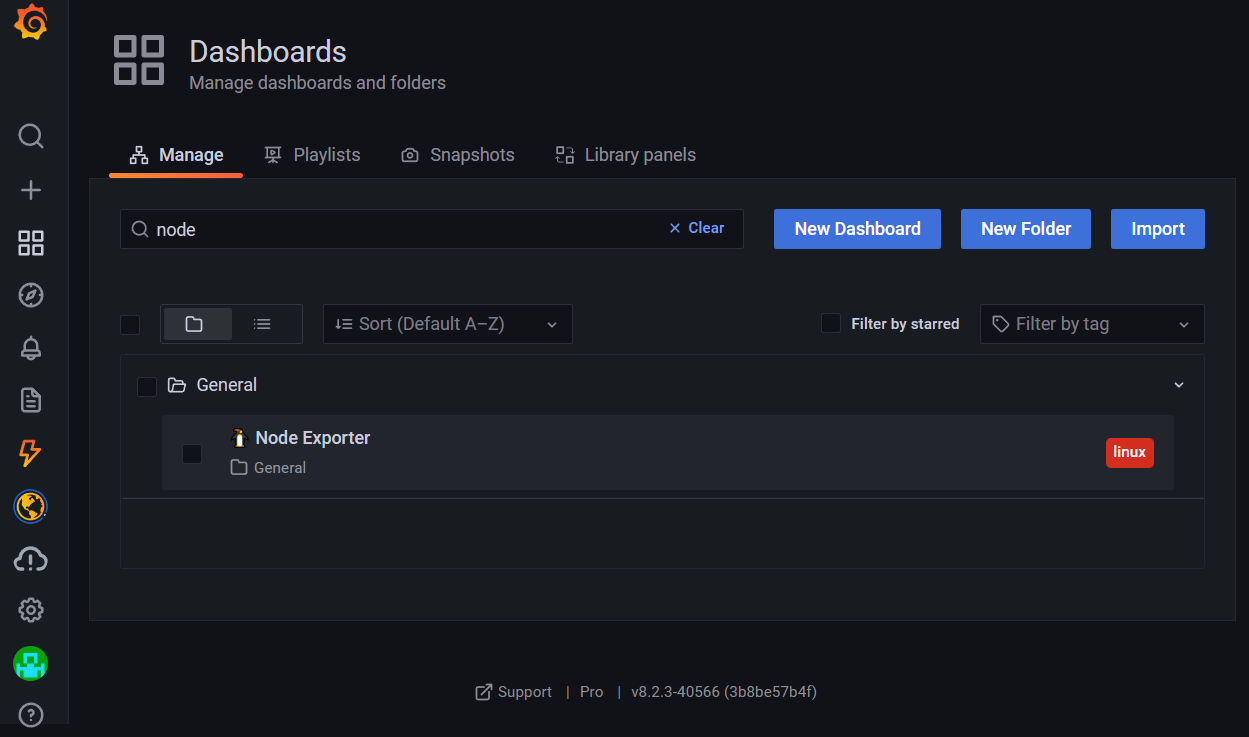
From the left menu, navigate to Dashboards > Manage and click the Import button.
Insert 1860 (which is the unique ID of our dashboard) and click Load. You should now see the dashboard which you’ve just added:
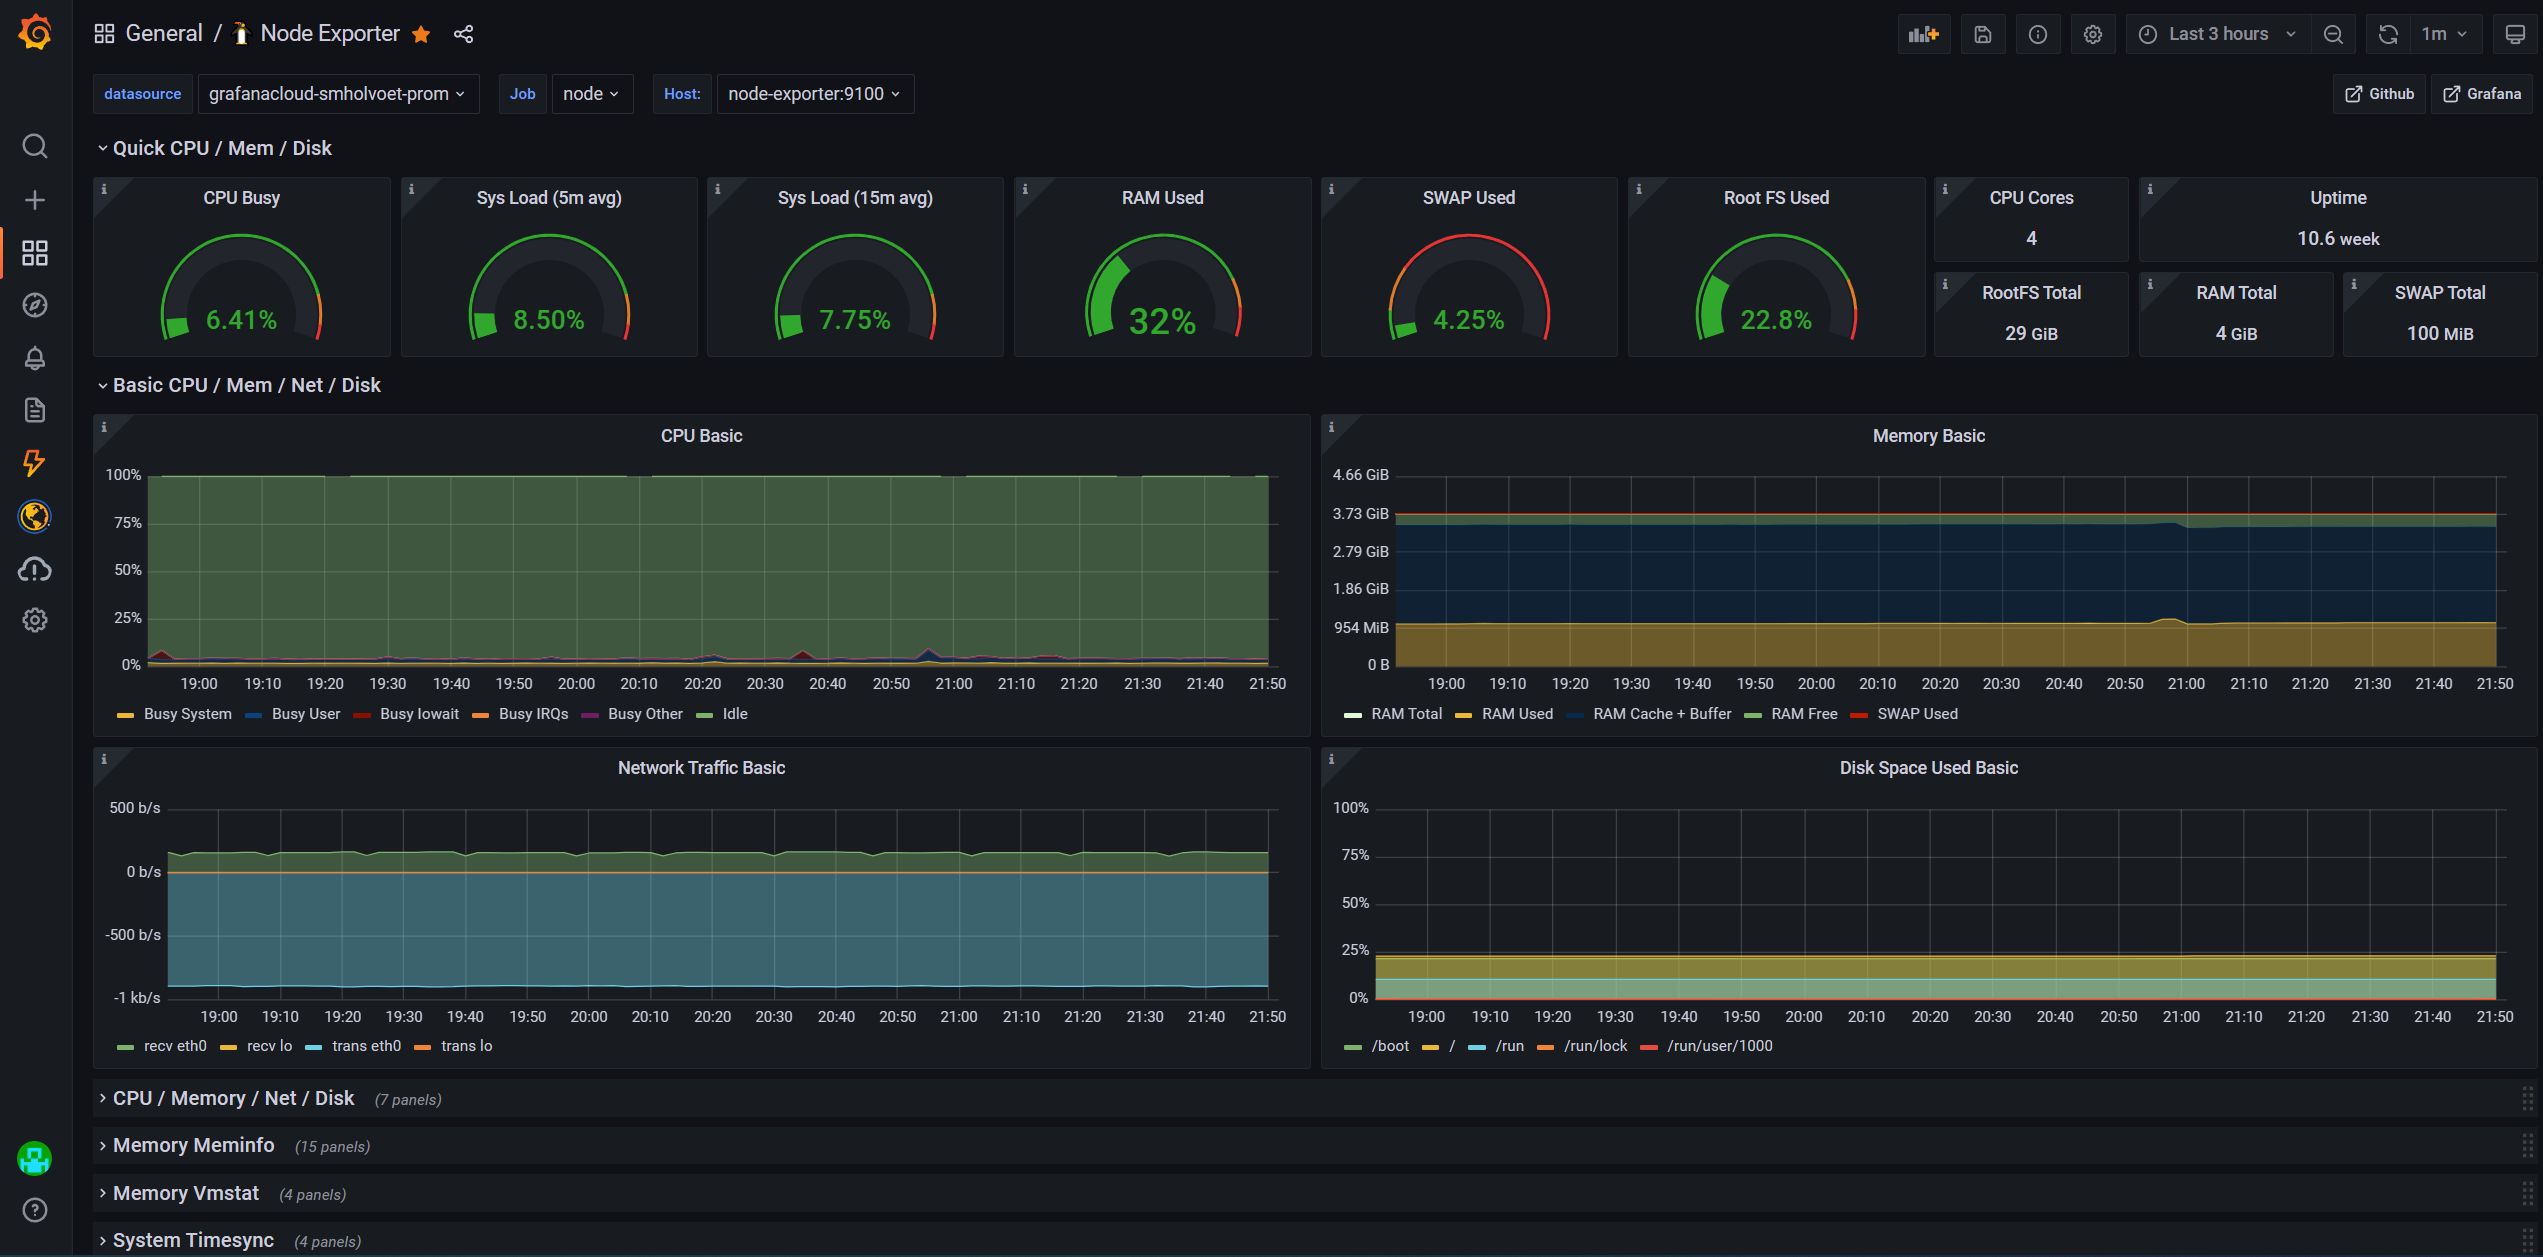
Result
This is what the end result should look like :
Comments