Debug standard objects in Dynamics 365
The below steps will show you how to use the built-in debugger and set breakpoints in any of the standard objects within D365 F&O.
Symbol settings
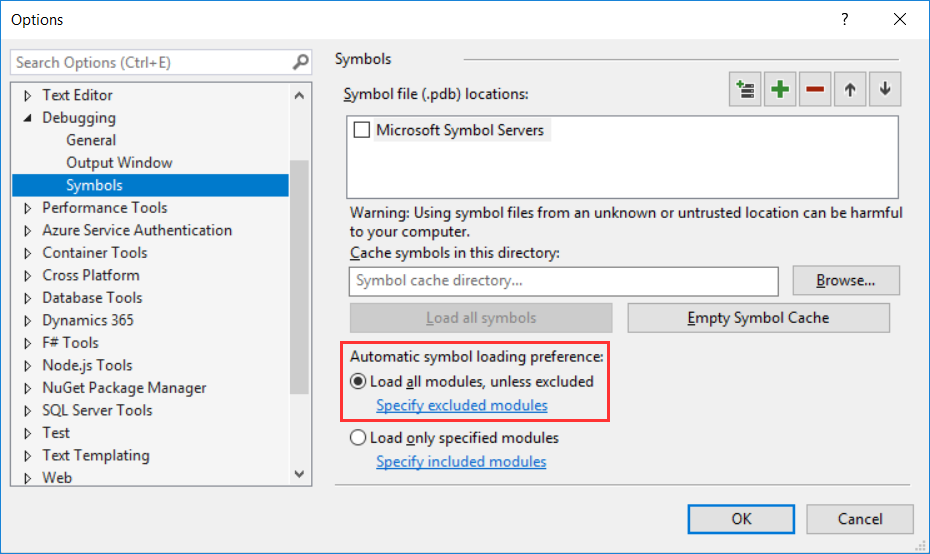
Navigate to Tools > Options > Debugging > Symbols and check Load all modules, unless excluded:
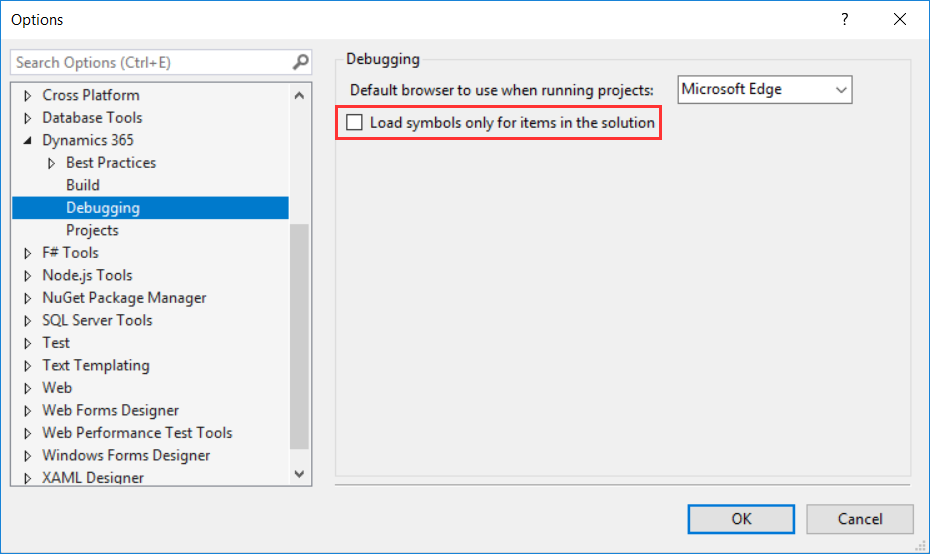
Keep the same Options window open and navigate to Dynamics 365 > Debugging. Make sure Load symbols only for items in the solution is unchecked:
A general explanation surrounding the use of symbol files within Visual Studio can be found here.
Set a breakpoint
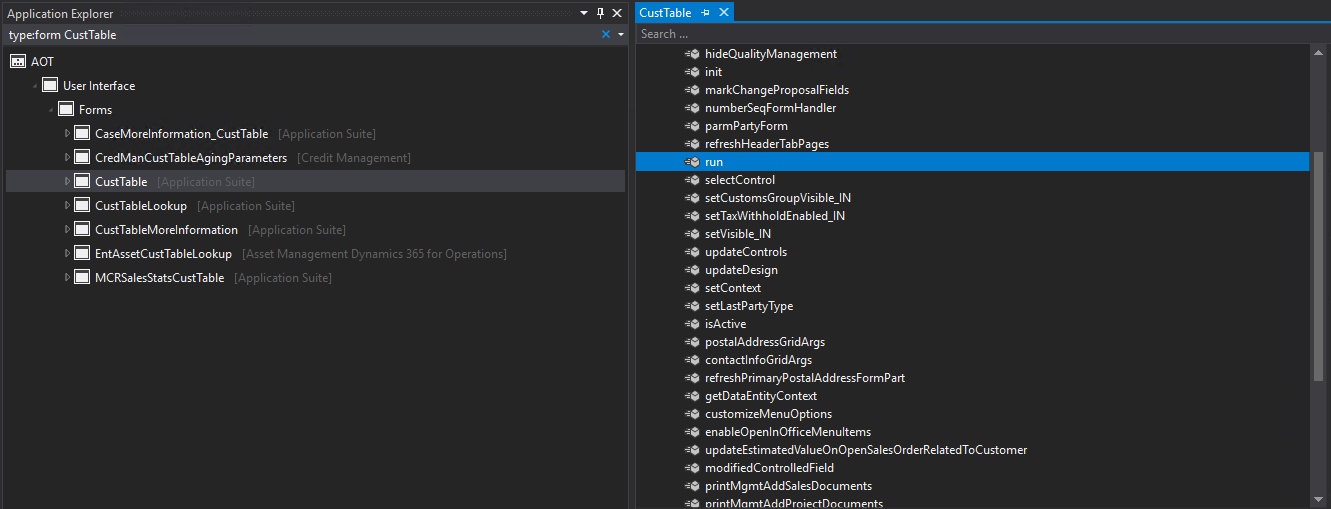
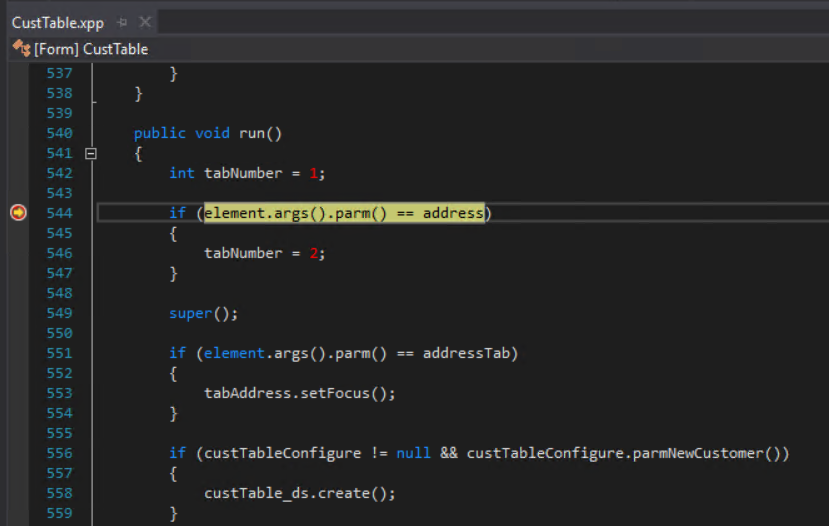
Lets add a breakpoint to a standard object, for example the run method of the CustTable form:
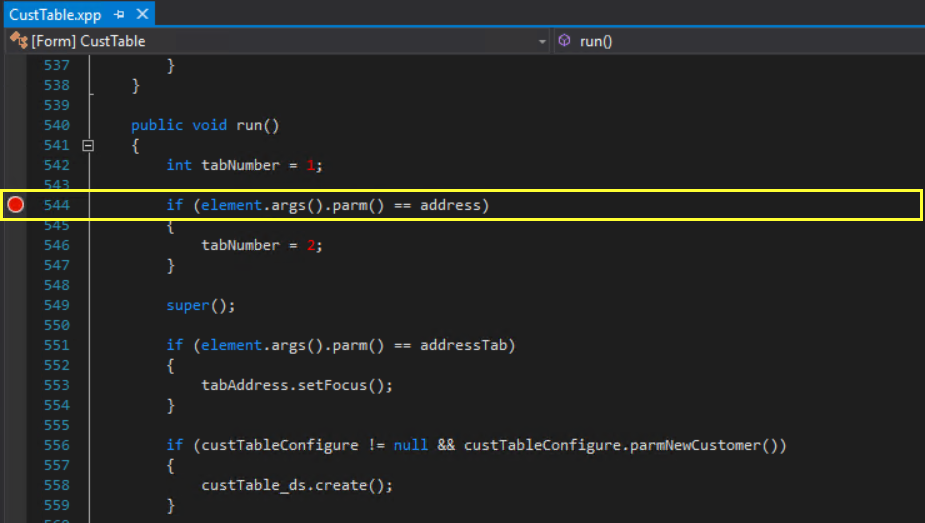
Add the 🔴 breakpoint (F9):
Attach to process
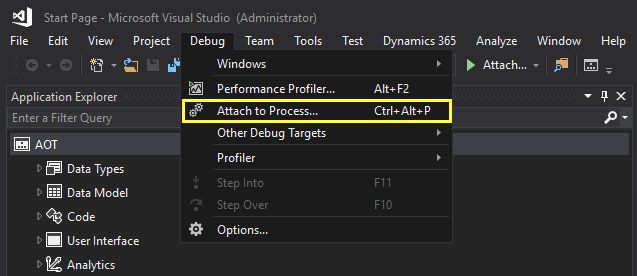
Navigate to Debug > Attach to Process, which will open the Attach to Process dialog box:
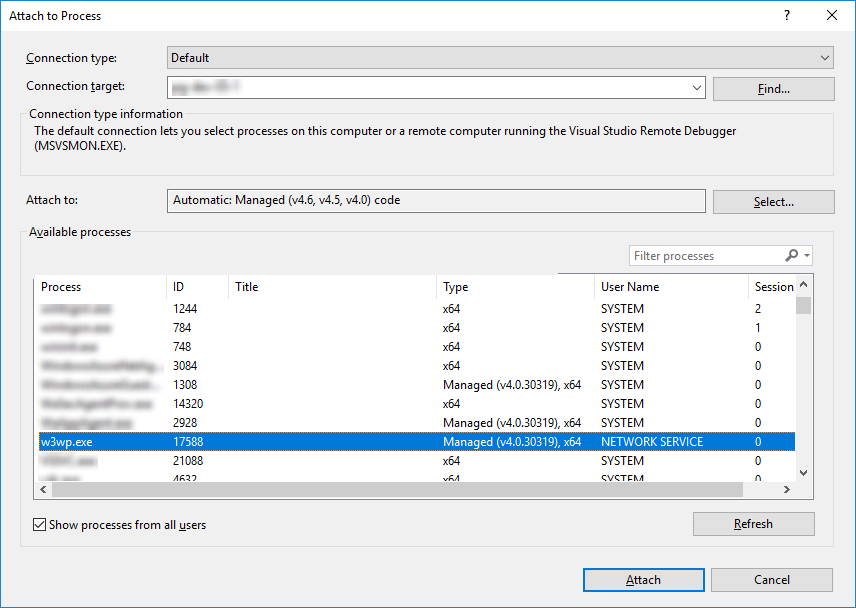
- Connection type: leave Default selected
- Connection target: hostname of your local machine
At the bottom, make sure to select Show processes from all users. In the list of Available processes, search for the w3wp.exe process. This is the IIS worker process, the local web server hosting our F&O instance.
⚠️ If you’re using IIS Express instead of IIS, search for the iisexpress.exe process.
After selecting the correct process, click Attach. This will start the debugger within Visual Studio.
Launch browser
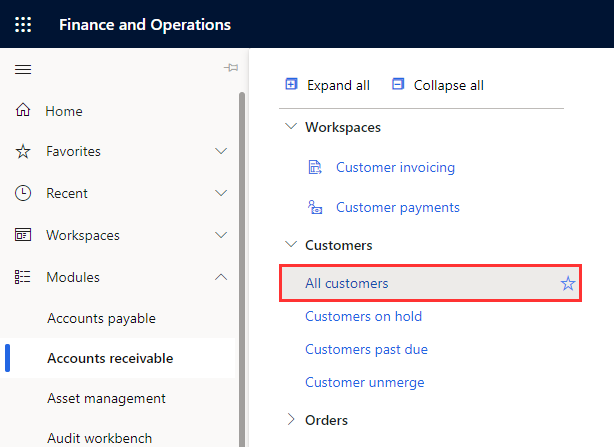
Now launch F&O from your browser and call the CustTable form by going to Accounts receivable > Customers > All customers:
Visual Studio will then hit the breakpoint upon loading the form:
More information on debugging within D365 F&O can be found on 📖 Microsoft Docs.
Comments